5.0 Site, Schedules, and Shade Control
The Site and Climate screen allows the user to set the project’s location and associated climate file, access shade control settings for window treatments in the model, and define the space usage schedule throughout the year.
The Site Selection and Site Information fields allow the user to set the project’s location and the associated climate file to use.
The Schedule fields are used to define weekly and annual occupancy schedules for the modeled space.
If any blinds or shades have been added on the geometry input page, the user will see the Shade Control button on the Site and Usage screen which will activate the Shade Control screen. This screen allows advanced shade control settings to be made. If these settings are not made manually by entering the Shade Control screen, the window shown to the right, will appear upon hitting the Next button. This window allows the user to either still enter the Shade Control screen to make more advanced shade control settings, select fixed or manual control, or select the automatic default shade settings. The default automatic shade settings uses a sensor placement and setpoint set in the same way as discussed in the Advance Shade Control section.
Selecting the Back button will take you back to the Geometry Input page. Depending on what changes are made different simulations may be retriggered.
Selecting the Next button from this screen will execute the daylighting calculations and activate the Electric Lighting Results screen. These will run in a SPOT calculation window, which can be minimized while reviewing the next screen. The user will be limited to this next screen until the calculations are finished.


5.1 Site and Climate Selection
These Site Selection and Site Information fields allow the user to select the most climatically representative city for their project. SPOT comes with a library of cities for which Typical Meteorological Year (TMY2) data is available (most US locations). This database of cities is organized and accessible to the user by selecting SPOT generic in the Climate Library pull-down menu and then using the State and City pull-down menus. A larger database including all the new updated TMY3 weather data is available on the SPOT website and available for download.
Other TMY2 climate files or EnergyPlus weather files (.epw) can be imported into SPOT by pressing the Convert EPW File button which allows for an EPW or TMY2 (.tm2) file to be selected for importing. SPOT will convert the selected weather file into the SPOT custom (.wea) weather file format. The newly imported climate file will be added to the base climate library for use on future SPOT projects and will be named according to the original weather file name.
The Remove Weather File button can be used to remove a weather file from the SPOT location library.
Selecting a city will populate the Site Information fields with the latitude, longitude, prime meridian, and elevation information in the TMY2 file. The user can override the default values with more precise latitude and longitude values if the TMY2 city’s location is too far away to predict the accurate solar position. Typically, if the building is within a couple degrees of the latitude or longitude of the representative TMY2 city, the solar angles are sufficiently similar.
Latitude – The locations latitude in degrees. North latitudes should be entered as a positive degree (0 to +90) and south latitudes entered as a negative degree (0 to -90).
Longitude – The locations longitude in degress. West longitudes (West of Grenwich England) should be entered as a positive degree (0 to +180) and East longitudes entered as a negative degree (0 to -180)
Prime Meridian – The longitude that defines the locations time zone. Typically, Prime Meridians are at every 15deg longitude intervals (ie. 15, 30, 45deg…). In the US, the Prime Meridian for the Eastern Time Zone is 75deg, the Central Time Zone is 90deg, the Mountain Time Zone is 105deg, and the Pacific Time Zone is 120deg.
Elevation – The locations elevation in either feet or meters. SPOT adjusts the intensity of the sun versus sky based on this elevation value. Higher elevations tend to have a more intense solar component and less intense sky component as there tends to be less atmosphere to scatter the sunlight and create skylight.

5.2 Shade Control
The Shade Control screen, shown to the right, allows the user to specify the type of shade control for each window/skylight treatment zone in the model. The treatment zones were previously defined on the Geometry Input page when entering each window. A treatment zone is a group of window/skylight shades or blinds that will be controlled together. On the right side of this page is an isometric and floor plan diagram. Any photosensor locations defined in the treatment zone table will show up on these diagrams to assist the user in proper placement.
The Treatment Zone control table allows the user to define the type of controls to use for each treatment zone. Each zone can either be assigned auto, manual or fixed control. These control algorithms are discussed in more detail here.
An auto control ties the shades to a defined photosensor location and setpoint which determines when the shades will be drawn or retracted. Auto-generating the shade position, by pressing the Position button, will place the photosensor on the exterior of the wall or roof that contains the shades for the given zone. Auto-generating the shade sensor setpoint, by pressing the Setpoint button, will set the setpoint just above the brightest cloudy day, ensuring that the shades will be retracted under overcast conditions but drawn during most instances of direct sunlight.
The Advanced Setpoints button activates the Advanced shade control settings window which can be used to optimize the control of an automated shade control using an exterior photosensor.

5.2.1 Treatment Zone Control Definition Table
The Treatment Zone Control table is used to define the control settings for each treatment zone. This table consists of the following components:
Treatment Zone – There is one row in the table for each treatment zone defined on the geometry input page. The first column indicates which treatment zone each row represents. The radio buttons next to the treatment zone column are used to select a given treatment zone for the automatic generation buttons described in the next section.
Shade Control Type – This column sets the control type for each treatment zone. Three control types can be selected:
fixed, manual or auto. The fixed and manual control settings can be used to simulate a whole range of user types from a completely passive user that keep their shades down and fixed all the time to extremely active users that adjust their blinds regularly.
The fixed control simply keeps the blinds or shades shut for all the calculations. This control type can be used to simulate manual control for a ‘passive’ occupant.
The manual control treats each window individually and according to the manual shade exitance threshold and time delay settings on the Advanced Options page. When SPOT performs its simulations, it will look at the light leaving each window (exitance) and if it has exceeded the limit it will shut the window treatment until the final glare occurance and set time delay have passed.
The auto control type simulates the treatment zone being controlled by a defined photosensor position, type, and setting. The rest of the fields in the definition table relate to the sensor settings and do not apply with ‘fixed’ shade control. Automatic shade control also assumes an ‘open-loop’ sensor placement where the photosensor signal does not change depending on whether shades are drawn or retracted.
Shade Control Sensor Vectors – The three adjacent position fields define the location, aiming and rotation of the sensor for the current treatment zone using vector notation. The X values for each vector (1st number) represent the E-W dimension of the space. The Y values (2nd number) represent the N-S dimension of the space. The Z values represent the height component. The vectors must be entered with a comma separating the X, Y, Z values. The vectors do not have to be unitized.
Shade Control Sensor Location – The location vector gives mounting coordinates. The user will have to ensure the sensor does not get placed within a wall, overhang, or lightshelf element as this will result in inaccurate results. The button, discussed above, will automatically input the sensor location field for the selected Treatment Zones.
Shade Control Sensor Aiming – The aiming of the sensor gives the direction in which the photocell is looking. The button, discussed above, will automatically input the sensor aiming field for the selected Treatment Zones.
Shade Control Sensor Rotation – The rotation of the sensor indicates the direction in which the prominent sensor housing feature will face. The default is up for sensors on a wall and local building north for sensors on the roof. The button, discussed above, will automatically input the sensor rotation fields for the selected Treatment Zones.
Sensor Type – This field designates the type of photosensor to use. The current database of photosensor types includes five generic sensor spatial sensitivity distributions: a cosine distribution, 45o cone cosine, 55o cone cosine, 65o cone cosine, and an old Watt Stopper coned distribution, TWS-1. In addition, the specific photocell products tested in the 2007 NLPIP Specifier Report on Photosensors (see Appendix E for reference) are included in the SPOT database. Refer to Section 5.3 for more information on the sensors available.
Shade Sensor Setpoint – These fields define the sensor set-point in terms of ‘signal’ and in terms of illuminance at the sensor. The ‘signal’ setting relates to the response generated by the given sensor distribution file, which is only equal to illuminance for a cosine distribution sensor. The illuminance field indicates the illuminance on the sensor that would produce the given signal under a standard CIE overcast sky distribution. Both these fields will be automatically filled out if the button is selected. After this button has been selected, the corresponding illuminance field will automatically be updated. The signal is all that matters for SPOT, but the corresponding illuminance field can give useful information for commissioning purposes.

5.2.2 Advanced Automatic Shade Control Settings
The Advanced Setpoints button will initiate a more complex shade control sensor calculation and bring an advanced shade control setting chart to the forefront. Initially, a DOS calculation window will pop up and will take approximately 1 minute to 10 minutes to complete depending on the project’s settings. This DOS window calcs have to finish before you can continue in SPOT. Once it is complete, a sensor signal chart will appear, as seen to the right.
The chart shows the sensor signal for the selected treatment zone for the annual design day set of daylight conditions. The green line on the graph indicates the current setpoint for the given sensor. Times of the year that are below this threshold will have no window treatment and times of the year above this threshold will have the window treatment. This chart is useful for determining a shade sensor signal setpoint for optimal annual shade control. As seen in the example chart to the right, this is for a west-facing sensor and it can be seen that up until noon there is no direct sunlight on the facade and the signal is at 2000 or below. Setting the shade sensor signal just above this level will be more optimal in keeping the shades open for longer periods of time.
The Get Default button allows the user to retrieve the default sensor setpoint setting. The default setting is based on the brightest overcast sky condition ensuring the shades are open under overcast conditions but drawn for most sunny conditions. The default setpoint calculation finds the brightest overcast condition and sets the setpoint just above this condition. The advanced shade setpoint chart allows you to refine the setpoint beyond this default.
The Treatment Zone pull-down menu selects the treatment zone to view in this window. To adjust the sensor setpoint, remember the signal you want to use for the setting and press the Hide button to enter the new setpoint in the Treatment Zone table.
The Max mA field and Change mA button can be used to change the maximum Y-axis of the chart. This can be useful in getting a better resolution of the sensor signal.

5.3 Schedules
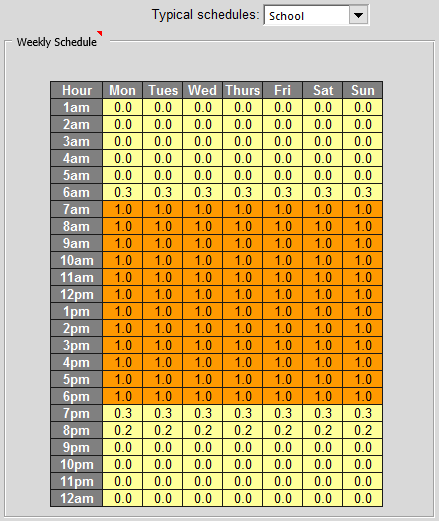
The Typical Schedules pull-down menu can be used to populate the Weekly and Annual Schedule tables, described below, with ‘typical’ schedules for a couple common functions: School (morning weighted, weekdays), Office (weekdays), Airport (heavy mornings/afternoons, weekends). There is also an option to use ‘all hours’. If the building functionality is unknown or is likely to change over it’s lifetime, than it is recommended to do daylighting analysis using ‘all hours’. If the building will have a very specific use and function over it’s lifetime (like most schools) than a more customized schedule that best reflects the buildings use is recommended.
Weekly Schedule
The weekly schedule table shown to the right defines 7 daily building occupancy schedules, one for each day of the week. The schedule can impact both the annual metric calculations and the annual energy saving calculations.
For the annual metric calculations the unoccupied times, either weekly hours that are set to 0.0 or annual days that are set to “U“noccupied, are not included with the exception of the sDA and ASE metrics defined in the IESNA LM-83 document. Skipping weekends usually does not have a big impact, but if you want to ensure everyday is included the same way in the annual metric make the daily schedule identical for all 7 days and then use the annual schedule to mark which days throughout the year should be included.
For the energy calculations, the fraction of occupancy indicated in the weekly schedule is also taken into account. A value of one means the space is fully occupied and the lights would be fully on if not controlled with a photosensor system. A value of 0.5 indicates that 50% of similar spaces are occupied (when using a space multiplier in the annual calculations) or a single space is occupied during that hour 50% of the time. A value of 0 means the space is not occupied. This is used as a multiplier when performing the annual energy calculations to account for occupancy impacts in the potential daylight energy saving predictions.
Annual Schedule
The annual schedule table shown to the right defines an annual daily occupancy schedule for the space and is used the same in the annual metric and energy calculations: if a day is marked “U” for unoccupied it is not included. The table is a grid of cells, which represent each day of the year with the months listed along the top and the day along the side. “O” for occupied and “U” for unoccupied are used in each cell to indicate which days are and which are not occupied. Note that an unoccupied “U” input in the annual schedule means the entire day is absolutely unoccupied and the weekly schedule is unused. An occupied “O” input in the annual schedule means that the space abides by the weekly schedule for that day. January 1st is chosen arbitrarily to be a Monday (calendar year 2007 for coordinating with a DOE-2 schedule). The diagonal yellow and blue buttons at the top of this table allows the user to fill an entire month or the entire year as either occupied or unoccupied. Clicking the blue portion of the button will fill in unoccupied “U” values and clicking the yellow portion of the button will fill in occupied “O” values.

-
-
2.0 Project Setup
-
3.0 Geometry Input
3.1 Advanced Option
3.1.1 Calculations
3.1.2 Shading Devices
3.1.3 Radiance Parameters
3.1.4 rvu operation
3.2.1 Material Library Editor
-
-
-
-
-
-
-
10.0 Annual Analysis
10.1 Daily Results
10.2 Hourly Results
10.3 Detailed Results
10.4 Commissioning Report