10.0 Annual Analysis
The final Annual Analysis screen reports a variety of annual performance calculations. Some of the calculations are essentially the same as those performed on earlier screens for the representative days except now they are run using an expanded set of ‘Design Day’ calculations, as discussed in the SPOT Development Report, and for each 8760 hours of weather data. This provides a more accurate analysis of the photosensor system since it now takes the climate conditions, schedules, and time of the day into account – i.e. coincident load type issues. Several sets of results are displayed on this screen. The user can utilize Excel’s print functionality to print any reports desired.
Annual Results At the top of the Annual Analysis screen is a table of the annual results as shown to the right. The table to the left lists the average light output, electric savings, heating load, cooling load, and average, minimum, and maximum illuminance for each zone individually and all zones together. Next to this table are some additional Building / Campus Information inputs. Here, the user specifies a multiplier that is used to calculate savings for a group of similar spaces and the blended utility rates for electricity and gas.
Building-Wide Results The table to the right provides building wide results for overall energy and energy cost savings. The total building wide energy related cost savings are provided at the bottom of this table. Remember, energy savings is only part of the equation for daylighting. Benefits related to productivity, well-being, health, enhanced learning environments, and increased retail sales should be considered and completely outweigh the energy saving benefits of daylighting.
The Daily Results chart provides a variety of performance information for the combined daylighting, electric lighting, and control system design for every day throughout the year. These results are useful in identifying seasonal variations in the daylight performance.
The Hourly Results chart provides a variety of performance information for the combined daylighting, electric lighting, and control system design for every hour of average monthly performance. These results are useful in identifying hourly, morning to evening, variations in the daylight performance.
The Detailed Results chart provides a variety of performance information for the combined daylighting, electric lighting, and control system design for every grid point throughout the space. These results are useful in identifying any locations in the space that underperform.
The CX Report button opens up the Commissioning Report pages. These can be used to print standard information regarding the photosensor system location and settings that can then be used in the field to assist in the commissioning of the actual photosensor systems.
The DOE-2 Schedule and the EnergyPlus Schedule buttons generate output files that can then be imported into the DOE-2 or EnergyPlus whole building energy simulation programs. In this way, the detailed lighting performance calculations from SPOT can be integrated into a more detailed model of the entire buildings energy systems.

10.1 Daily Results
The next section of the Annual Analysis screen consists of a table showing results for each day of the year, as illustrated to the right, and a pull-down menu that selects the data displayed in the table. These results can be used to identify certain days of the year that may be under performing. Each day of the month represents the columns and each month represents the rows in this table.
A color-coding system is provided for this table when illuminance numbers are displayed to help show daily performance relative to the set design illuminance. The Critical Day is represented on the graph as the cell with the thick black outline and represents the day that had the lowest average workplane illuminance. If minimum or maximum illuminance is selected in the pull-down menu, then the lowest minimum or highest maximum illuminance is highlighted as the Critical Day.
The options to display on the table are selected in the pull-down menu and include:
Average Light Output [%] – This option displays the daily average light output for all luminaire zones, weighted according to the overall lighting power.
Average Illuminance [fc or lux] – This option displays the daily average workplane illuminance under electric light and daylight.
Maximum Illuminance [fc or lux] – This option displays the daily maximum workplane illuminance under electric light and daylight.
Time of Maximum Illuminance [hour] – This option displays the time of day, in military decimal form, when the maximum illuminance occurred.
Minimum Illuminance [fc or lux] – This option displays the daily minimum workplane illuminance under electric light and daylight.
Time of Minimum Illuminance [hour] – This option displays the time of day, in military decimal form, when the minimum illuminance occurred.
Electric Savings [kWh/day] – This option displays the daily electric savings achieved. This represents the electric savings due to the electric lighting system only and not other indirect electric savings due to reduced fan power and cooling electricity requirements.
Additional Heating Load [kBtu/day or kWh/day] – This option displays the additional heating load imposed on the space due to the lack of heat gain from turned off electric lighting.
Cooling Load Savings [kBtu/day or kWh/day] – This option displays the reduced cooling load provided to the space due to the lack of heat gain from turned off electric lighting.

10.2 Hourly Results
The next set of results consists of a color-coded hourly results table and a pull-down menu to choose the data to be displayed as shown to the right. The hourly results table has a row for each month of the year, January through December, and a column for each hour, 1 through 24. The data displayed represents the monthly average for that particular hour. This can inform the user of which times of day are and are not performing well. Similar to the daily results, the Critical Hour is highlighted. This represents the hour with the lowest average monthly illuminance in a typical year. If minimum or maximum illuminance is selected in the pull-down menu, the Critical Hour highlighted is either the lowest minimum illuminance or higher maximum illuminance.
The options to display on the table are selected in the pull-down menu and include:
Average Light Output [%] – This option displays the monthly average light output for all luminaire zones for each hour of the day, weighted according to the overall lighting power.
Average Illuminance [fc or lux] – This option displays the monthly average workplane illuminance under both electric light and daylight.
Maximum Illuminance [fc or lux] – This option displays the monthly maximum workplane illuminance under both electric light and daylight.
Day of Maximum Illuminance [day] – This option displays the day of the month when the maximum illuminance occurred.
Minimum Illuminance [fc or lux] – This option displays the monthly minimum workplane illuminance under electric light and daylight.
Day of Minimum Illuminance [day] – This option displays the day of the month when the minimum illuminance occurred.
Electric Savings [kWh/month] – This option displays the electric savings achieved for the given hour over the entire month. This represents the electric savings due only to the electric lighting system and not other indirect electric savings due to reduced fan power and cooling electricity requirements.
Additional Heating Load [kBtu/month or kWh/month] – This option displays the additional heating load imposed on the space due to the lack of heat gain from turned off electric lighting.
Cooling Load Savings [kBtu/month or kWh/month] – This option displays the reduced cooling load provided to the space due to the lack of heat gain from turned off electric lighting.

10.3 Detailed Results
The last table on the Annual Analysis screen is similar to the table shown on the Design Tool – Daylight Calculations screen except it now represents true annual data rather than an approximation from the given representative days. Similar to the tables discussed above, the table is color-coded to show the relative performance when illuminance values are selected in the pull-down menu, as illustrated to the right. The Critical Point in the room is also highlighted for average, minimum, and maximum illuminance selections. When average illuminance is selected, the point highlighted is the point in the room that receives the lowest annual average illuminance. When minimum illuminance is selected, the true Critical Point is highlighted, which is the point that received the lowest illuminance throughout the year. When maximum illuminance is selected, the point with the highest illuminance throughout the year is selected.
The data to display on the table is selected in the pull-down menu and includes:
Annual Average Illuminance [fc or lux] – This option displays the annual average workplane illuminance under both electric light and daylight.
Annual Minimum Illuminance [fc or lux] – This option displays the annual minimum workplane illuminance under electric light and daylight. This is the absolute critical point of the space.
Day of Minimum Illuminance [m.d] – This option displays the month and day the minimum illuminance occurred for each point on the workplane.
Time of Minimum Illuminance [hr] – This option displays the hour the minimum illuminance occurred for each point on the workplane.
Annual Maximum Illuminance [fc or lux] – This option displays the annual maximum workplane illuminance under both electric light and daylight.
Day of Maximum Illuminance [m.d] – This option displays the month and day the maximum illuminance occurred for each point on the workplane.
Time of Maximum Illuminance [hr] – This option displays the hour the maximum illuminance occurred for each point on the workplane.
The Workplane Illuminance for Specific Time button below the pull-down menu, takes the user to the Climate Specific Results page previously accessible in the program. At this point, the results displayed on this page will be more accurate than before as they will be based on the denser analysis mode sample days.

10.4 Commissioning Report
Reports can be automatically created and printed to take onsite for commissioning the modeled space and photosensor system. The figure to the right shows the first portion of the report that gives the photosensor image, actual commissioning settings in terms of the controllers setting options along with any important manufacturer commissioning notes. Systems that are set by dimming the electric lights have SPOT commissioning settings given in terms of nighttime illuminance. Only the controller range tested in the Photosensor Specifier Report are available for interpolation for the SPOT commissioning reports therefore SPOT might not be able to give settings for some combinations of controllers and settings entered on the Photosensor Analyzer page. This can be a sign of a system that is difficult to commission but not necessarily limited in commissioning ability, so consult the manufacturer in these circumstances.
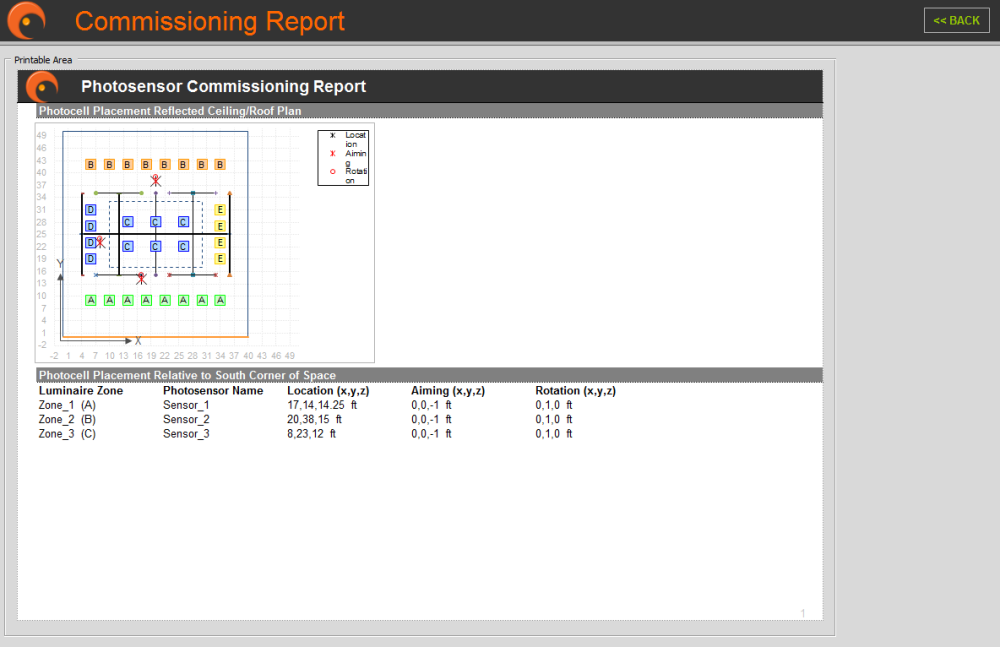
The View Position Page brings up the photosensor positioning commissioning report page. The image to the right shows the 2nd part of the commissioning report that gives a summary of photocell location, aiming and rotation. This should be taken to the field as well because a system can only be commissioned properly with the setpoints given in SPOT if the photocell is in the proper position.
The Print button can be used to print all pages of the commissioning report. Regardless of the current page selected, hitting the print button will allow the user to send each page of the report to the printer.

10.5 DOE-2 and EnergyPlus Output
The DOE-2 Schedule and EnergyPlus Schedule buttons generate output files that can be used in the named whole building energy modeling tool.
For DOE-2, include files with the annual LPD results are created. These can be included in a DOE-2 deck to simulate the hourly lighting controls for the given space. The DOE-2 Schedule button opens up a window, see image to the right, that requests a new file name and directory location to save the DOE-2 include (*.inc) file(s).
For EnergyPlus, an 8760 text file is created that can be referenced in EnergyPlus. The EnergyPlus Schedule button opens up a window that requests a new file name and directory location to save the EnergyPlus 8760 text (*.txt) file(s).
Example text that could be used in an EnergyPlus schedule file to reference an 8760 .txt file created by SPOT (named “Office1_8760”) is as follows:
Lights,
Office1_lighting, Office1, Lighting_Office1, Watts/Area, , 8, , 0.0, 0.42, 0.18, 1.0, GeneralLights;
SCHEDULE:File,
Lighting_Office1, Fraction, Office1_8760.txt, 188, 1;

-
-
2.0 Project Setup
-
3.0 Geometry Input
3.1 Advanced Option
3.1.1 Calculations
3.1.2 Shading Devices
3.1.3 Radiance Parameters
3.1.4 rvu operation
3.2.1 Material Library Editor
-
-
-
-
-
-
-
10.0 Annual Analysis
10.1 Daily Results
10.2 Hourly Results
10.3 Detailed Results
10.4 Commissioning Report